Comrades Marathon
Comrades Data
Data for the Comrades Marathon, authored by Kyle Stratton, can be found at data is plural and Kaggle. The Comrades Marathon is the world’s largest and oldest ultramarathon race held in South Africa since 1921. The dataset only has twelve variables, of which half are categorically sorting what medal was awarded each race finisher. For this project, the categorical variable listing each race finisher by age group and sex group was plotted by each year of the race. This featured plot is a quantitative time series analysis of number of finishers by year, after inclusion of women and African Americans in 1975. Of note, the dataset categorizes the age groups with unlikely but fun namegroups: Seniors (ages 20-39), Veterans (ages 40-49), Masters (ages 50-59) and Grandmasters (ages 60+). A likely audience includes, but is certainly not limited to: running enthusiasts, sports research, Comrades event organizers, and media sponsors.
Line Graph with Multiple Series
The features of this line graph represent time by the x axis, and in the case of this plot, the strictly increasing quantity of time, with the years 1975-2019. The y axis represents the outcome variable, number of marathon finishers within the 11 (sometimes 12-hour time limit). When plotting a temporal sequence, the line graph is constructed by drawing lines to create a connected scatterplot, where this line graph plots the two variables (age group and sex) in a scatterplot, and then connects dots corresponding to adjacent time points. A line graph for time comparisons is ideal for visualizing how the sex and age variables change continuously over the 44-year period. This time-series data visualizes the number of marathon finishers across different years and the display of data points connected by straight line segments makes it excellent for showing trends and changes over a continuous period.
Visual Presentation
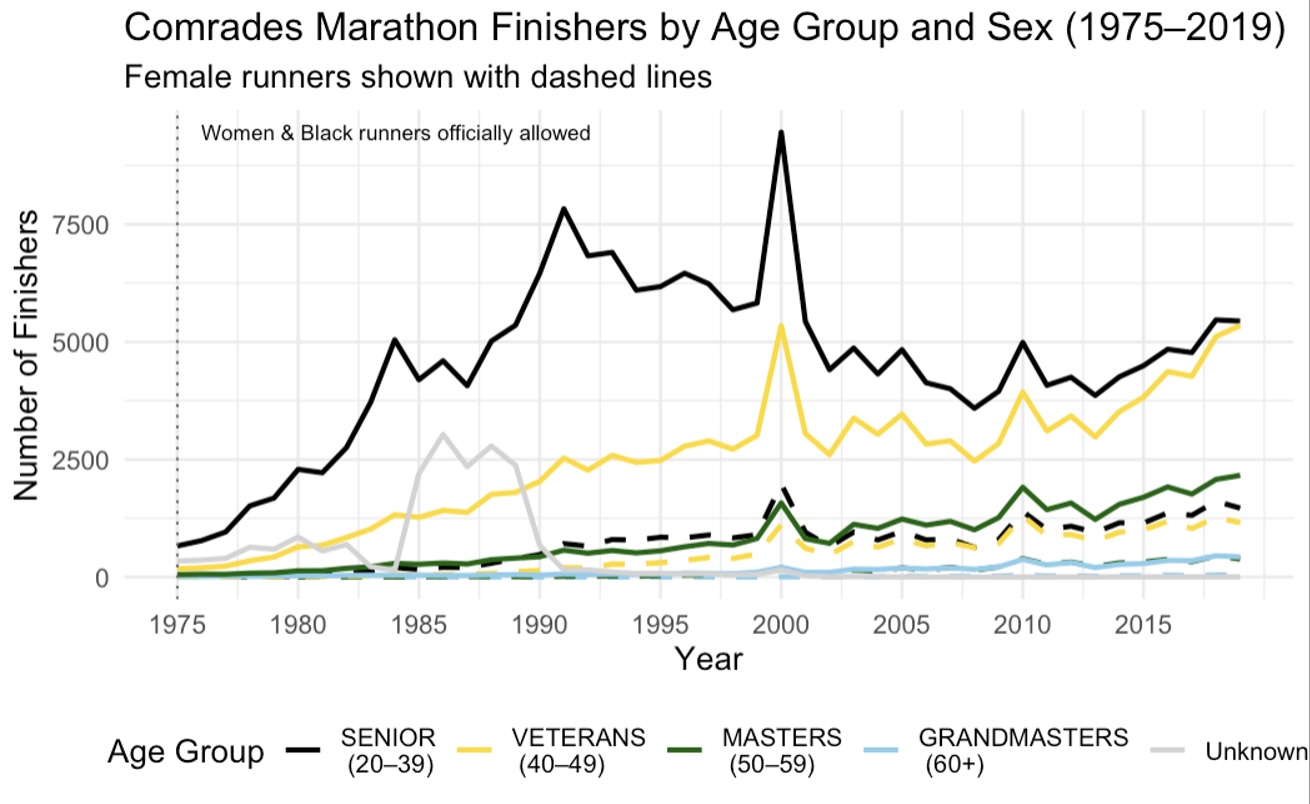
Take a look for trends over time for each age group and by sex. It is easy to see that the men’s Senior and Veterans groups have the most significant amount of variation and that the Veterans (men’s) group seems to be catching up to the Senior (men’s) group. Whereas the women’s Senior and Veterans groups have very little variation and the trend is not changing over time. There is a strong relationship with age and number of finishers that can be seen with this line graph. It is logical that there is more finishers with the younger age groups and as age increases the number of finishers decreases.
The large spike in the year 2000 really stands out on this graph. A reader might be curious why there is a huge increase in the amount of finishers? This is one of the years that the race completion time was extended to twelve hours. Additionally, it was the 75th anniversary of the race which also peaked interest (some years were missed for this race due to World War II). The gray line represents a few years in the 80’s when data for age and sex were not recorded.
Methods
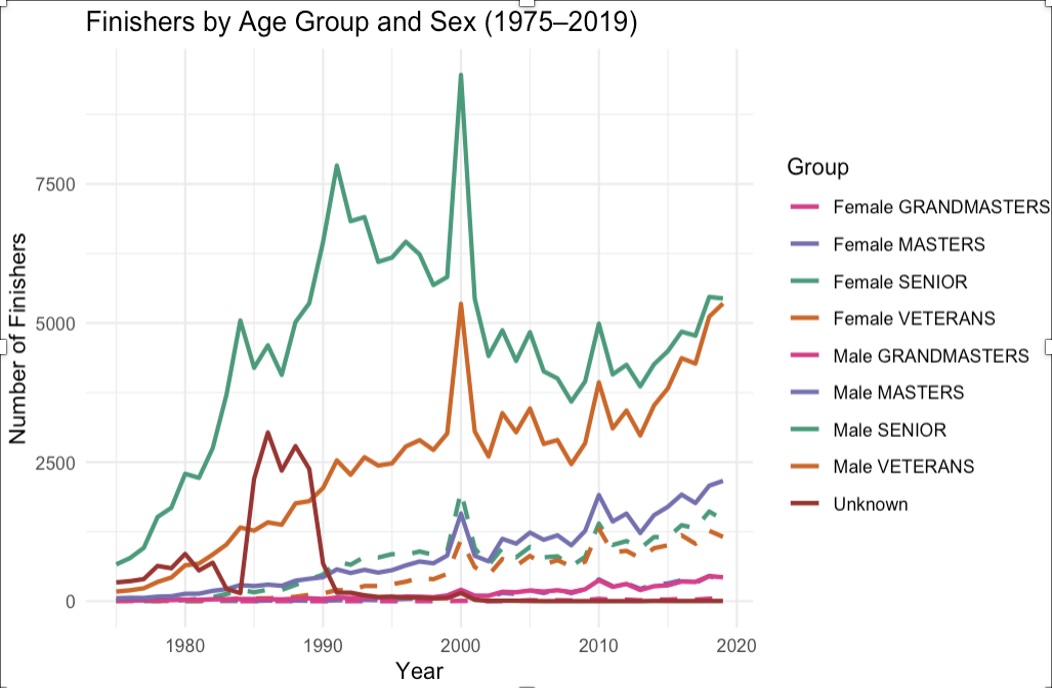
The original graph was too busy with so many age groups by sex. First, there was an addition of a subtitle to specify the women’s groups by dashed, rather than solid, lines. Using color and the dashed lines, each combination of age group and sex can be represented in only five colors. Additionally, it was necessary to strategically work with the color scheme to layer with lighter and darker colors so that the Masters and Grandmasters datalines would remain visible in parts where the lines were layered. The gray line was originally plotted in brown and also hid too many parts of some of the datalines for the Masters and Grandmasters groups. In the initial data wrangling, the data was lost for the Grandmasters age group entirely. Effectively ordering variables with mutate retained values for each age group and retained data points for each group. Finally, the use of coord_cartesian to eliminate extra white space and scale continuous highlights every five years on x-axis. As a final touch, annotate was used in the final plot to justify choice to plot beginning with the year 1975 and customizing the legend to stack groups with respective age limits.
Here’s my powerpoint for the project. Please download and enjoy!